 | Strand - Data Analysis (Using Statistical Methods)
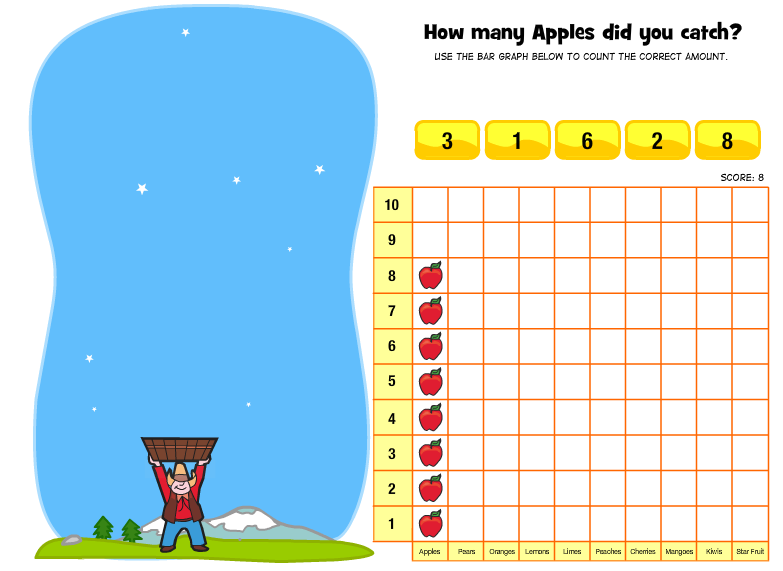
Students use the mouse to navigate back and forth to catch fruit falling from the sky. Each piece of fruit falling from the sky ends up on the graph. After each kind of fruit, the student clicks on the number at the top that matches the number for that fruit. The activity repeats 10 times with each fruit.
|
 | Strand - Data Analysis (Collect, Organize, and Display Data)
Students use data from 12 students by clicking on them. As each student is clicked on, it grays out and the answer appears in the tally chart. The user types the totals in for each row. Step 2 includes creating a bar chart with the same information. Step 3 includes creating a pictogram with the same information. Students can also choose a new question once the first one is complete.
|
 | Strand - Data Analysis (Probability)
Students demonstrate their knowledge of likely and not likely by clicking on the proper balloon covers. At the end of the game, student can paint their own scenario. |