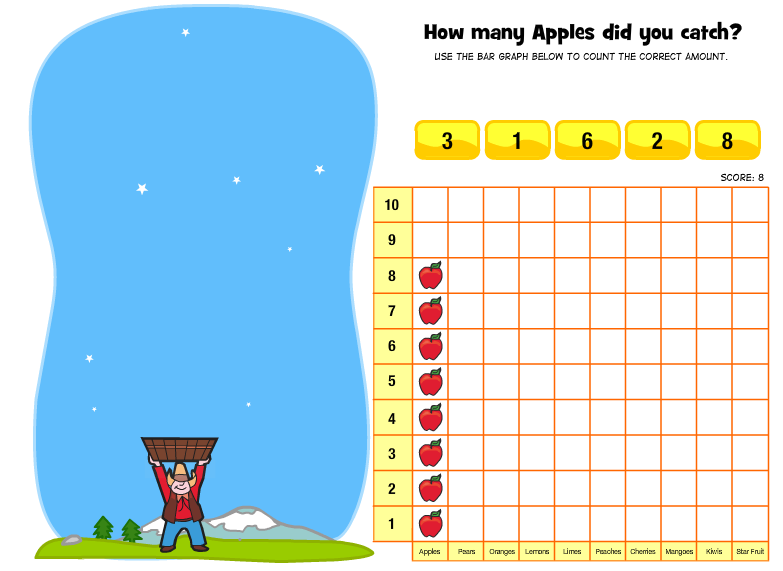
The primary goal of this activity is for students to associate objects they catch in their basket with those on the graph. After all of the fruit falls from the sky and they catch it, they have to report how many they caught by choosing the correct answer. |
What mathematical content is being learned (or intended to be learned)? | Students are learning to count on a graph and are using a graph that is meaningful to them in the context of the game. They work with quantity as they notice that items they caught more of have higher lines than items they caught less of. |
Is the focus on instrumental or relational understanding?
| The students observe the graph being made throughout their game. They begin to connect the "catching" they are doing with the numbers on the graph. |
What role does technology play? | The technology provides a way for students to create a graph that accurately reflects their activity. This is a good complement to graphs made in the classroom for other purposes. The technology allows them to observe the graph being made rather than being the creator, for a new perspective on graphing. |
What instructional function(s) does the resource serve?
| This activity doesn't ask the students to do the actual graphing, so it is an exploration, allowing them to observe graphing and being to build their schema about graphs. |
What kinds of representations of the mathematics are used?
| The activity uses pictorial graphs to show students the fruit they have caught. It displays a running tally of the total up in the corner as well. |